


- Gold struggled to gain any traction and remained depressed near multi-month lows.
- Bearish flag breakdown supports prospects for an extension of the recent downtrend.
- Any meaningful recovery attempt might be seen as an opportunity for bearish traders.
- Gold has dropped sharply below $1,800, breaking below the 200-DMA
Update: XAU/USD tumbled down to a fresh low of $1,774 at the time of writing, amid cascading stops, breaking below the 200-DMA. See:
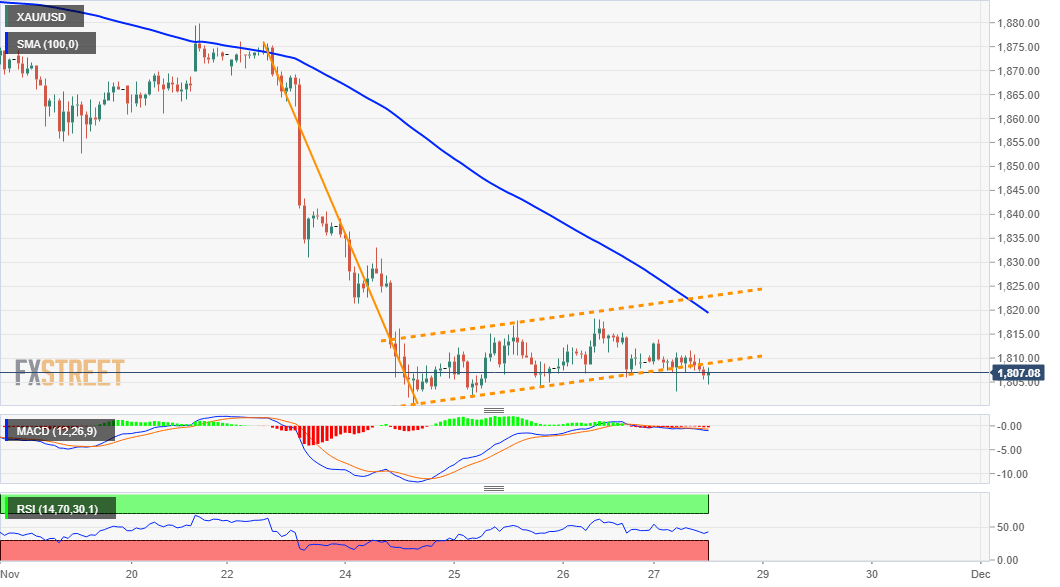
Gold traded with a mild negative bias through the mid-European session and was last seen hovering near the lower end of its daily range, around the $1805 region.
The XAU/USD now seems to have found acceptance below a three-day-old ascending trend-channel, which constituted the formation of a bearish flag on short-term charts. Bearish technical indicators on hourly/daily charts add credence to the negative set-up and support prospects for an extension of the recent downward trajectory.
That said, bearish traders might still wait for some follow-through selling below the very important 200-day SMA, around the $1800 mark, before placing fresh bets. The XAU/USD might then accelerate the downward trajectory towards the $1763 region – support marked by the 50% Fibonacci level of the $1451-$2075 strong move up.
On the flip side, any meaningful recovery attempt might be seen as a selling opportunity and runs the risk of fizzling out rather quickly near the $1818-20 region. This is closely followed by the trend-channel resistance, around the $1822 level, which if cleared decisively might trigger some near-term short-covering move.
Some follow-through buying has the potential to lift the commodity further towards the 38.2% Fibo. level resistance near the $1835 region, which should cap any further upside.
XAU/USD 1-hourly chart
Technical levels to watch


