Image copyright
Hulton Collection
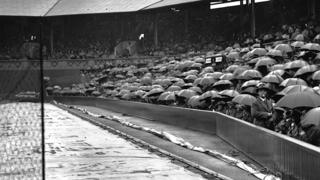
Scientists have been amazed at the public’s response to help digitise the UK’s old rainfall records.
Handwritten numbers on documents dating back 200 years are being transferred to a spreadsheet format so that computers can analyse past weather patterns.
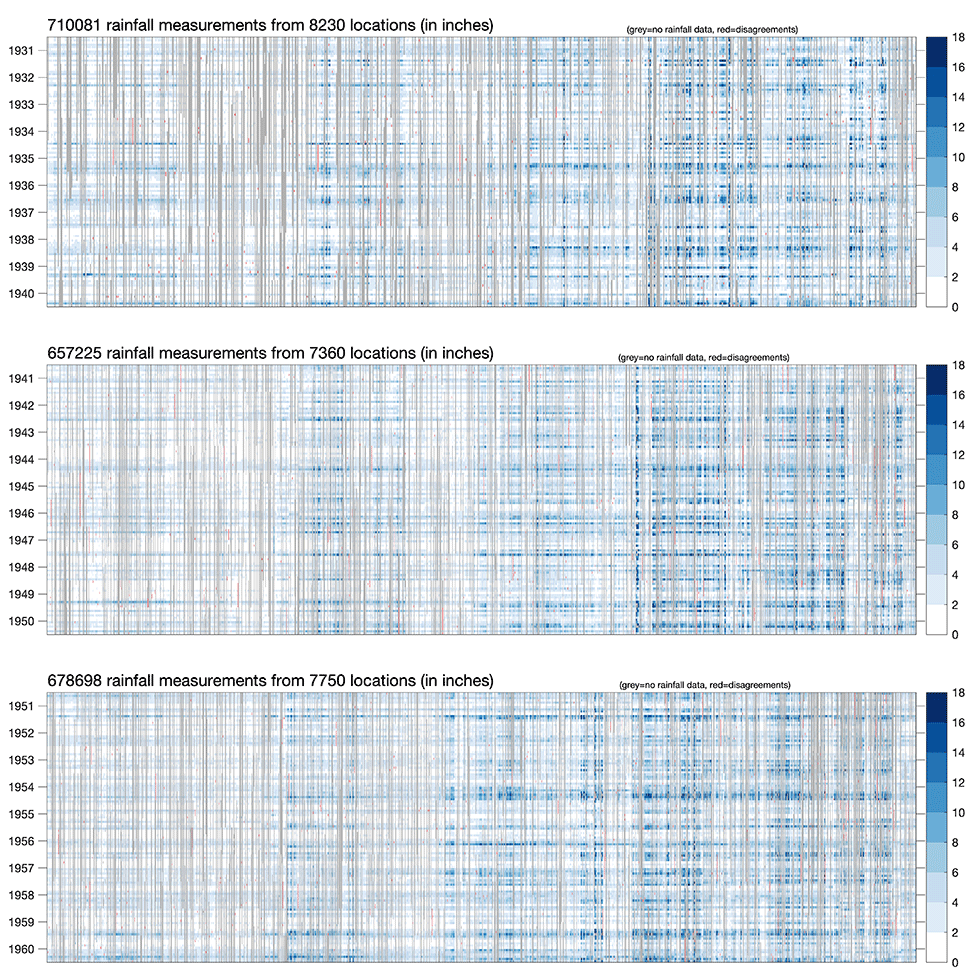
The volunteers blitzed their way through rain gauge data from the 1950s, 40s and 30s in just four days.
Project leader Prof Ed Hawkins had suggested the work might be a good way for people to use self-isolation time.
“It’s been incredible. I thought we might get this far after three or four weeks, not three or four days,” he told BBC News.
“We’ve had almost 12,000 volunteers sign up. They’re now working on the 1920s and I’m racing to get the 1910s ready for them.”
The Rainfall Rescue Project was launched just last Thursday.
Image copyright
Rainnfall Rescue Project
The volunteers powered through the 1950s, 40s and 30s. The chart above records the rainfall data available now across these decades. Two million data points. Grey lines denote months for which there is still no data, perhaps because a weather station had yet to start measuring rainfall or indeed had terminated the collection effort. The stronger blues to the right are simply a reflection of the stations’ locations – in the wetter parts of Scotland and Wales!
If you want to take part in the Rainfall Rescue Project, click here.
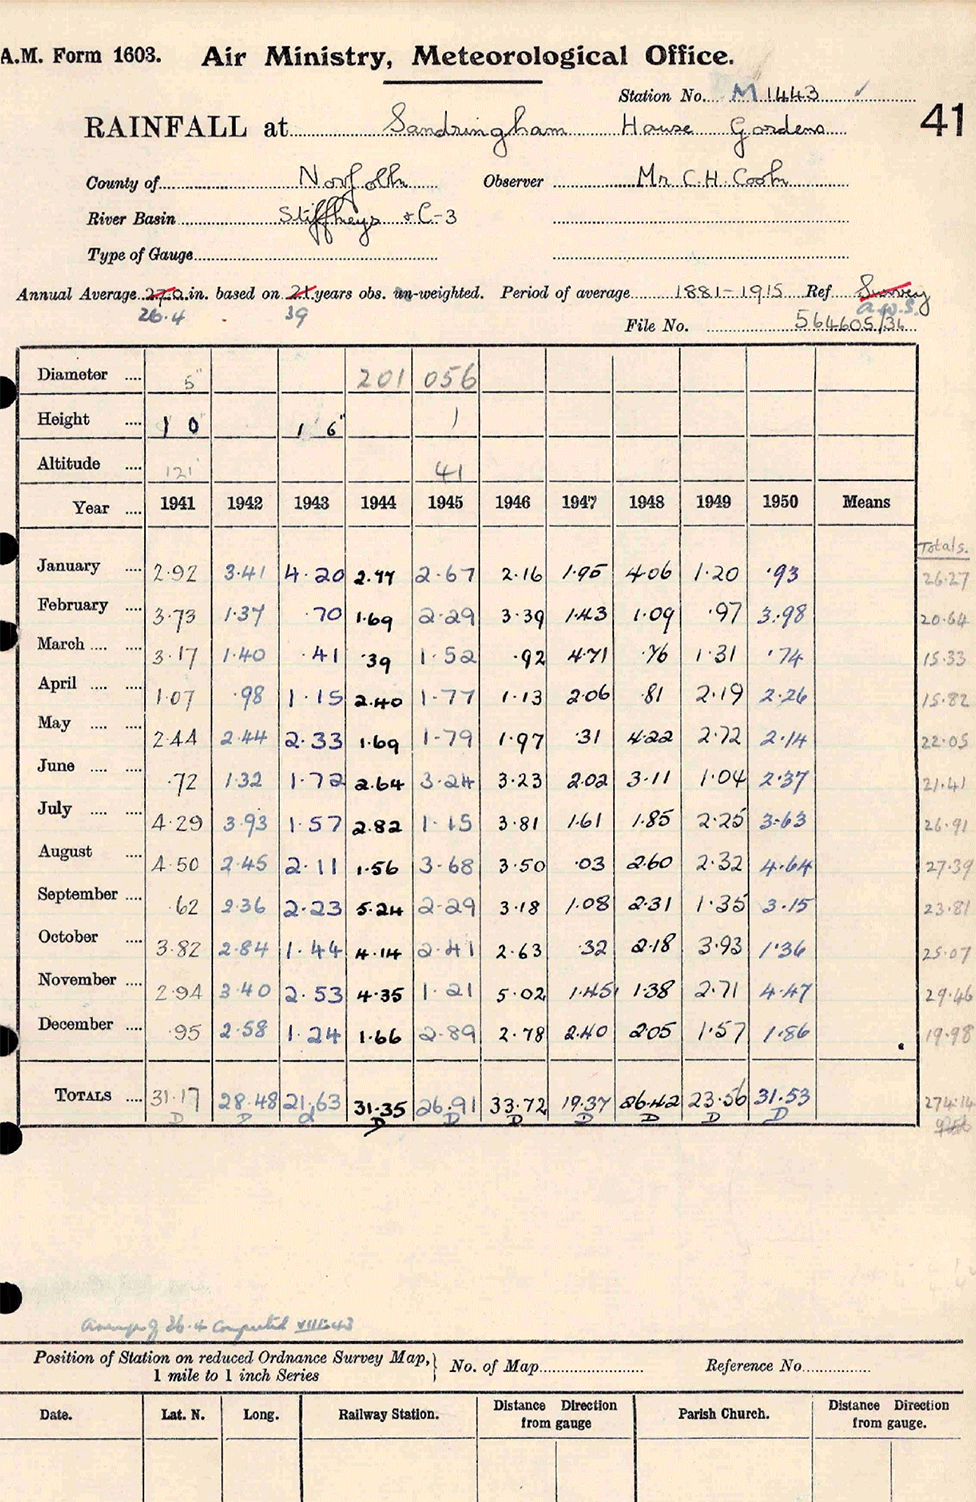
It’s aim is to recover all the entries on the so-called “10 Year Rainfall Sheets”.
These are the 65,000 pieces of paper in the UK Met Office archives that contain the monthly and decadal rainfall totals at thousands of weather stations across the country.
Buried in this mass of data is information that can inform flood and drought planning, but only if its scribbled numbers can be made computer-friendly.
The Met Office has had every sheet scanned, from the 1950s back to the 1820s (60s onwards are already digitised).
Volunteers who visit the Rainfall Rescue Project website are presented with these documents, one after another, and asked to transfer their numbers into a series of boxes.
Prof Hawkins has run a number of similar schemes in the past and is always asked why optical character recognition (OCR) software is not used. But such programs, he says, still can’t achieve the accuracy of humans.
The numerals “1” and “7” can look very similar across handwriting styles; likewise a “3” and an “8”.
“This tabulated numerical data is a particular challenge, I think, and no-one that we’ve spoken to yet – and they’ve been some pretty big companies; the likes of IBM and Google – has really cracked this,” the Reading University professor of climate science explained.
“We’re getting four volunteers to do every number, and by doing that we can get to over 99% accuracy. I’m sure OCR will improve but right now it can’t match what our volunteers do.”
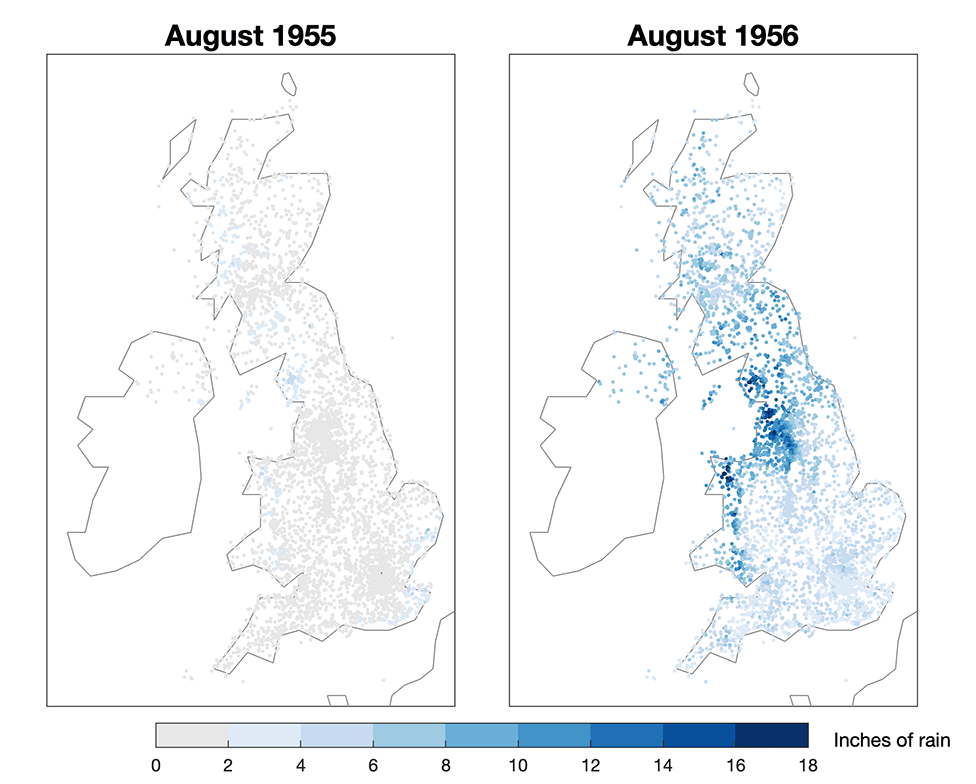
How different can the weather be from one August to the next? The rescued data from the 1950s shows one year had a very dry summer that was followed a year later by very wet conditions.
Those volunteers have been sharing anecdotes on the project website’s forum.
Rain-gauge records for the royal residences – Buckingham Palace, Balmoral and Sandringham – have been transferred.
People have taken delight in the notes added to the sheets by the original recorders.
There are stories of data being interrupted by trampling animals, and of children throwing stones at gauges. On one sheet from 1948, the abbot says his monastery’s time series was interrupted because the gauge had a bullet hole in it and needed repair.
“The volunteers have got really involved with it and started picking out interesting things themselves; they’ve started discussing months which are either really wet or really dry,” said Prof Hawkins.
“They went through 1938 and found the April of that year was exceptionally dry. Lots of places had zero rain for the entire month.”
The importance of recovering old weather records can’t be overstated.
It’s only by putting the present in the context of the past that we can plan properly for the future.
It’s only by having dense historic data that we will capture the full range of possibilities in terms of flood and drought frequency, and magnitude, for example.
If you want to take part in the Rainfall Rescue Project, click here.
Image copyright
UK MET OFFICE
An example of a 10 Year Rainfall Sheet: The rain gauge data for Sandringham House during the WWII
[email protected] and follow me on Twitter: @BBCAmos







![NiloCK/tuido: a text user interface for navigating [x]it! spec todo across multiple files](https://newsfortomorrow.com/wp-content/uploads/2022/08/tuido-225x125.png)


