


Today we’ll evaluate Sino-i Technology Limited (HKG:250) to determine whether it could have potential as an investment idea. Specifically, we’ll consider its Return On Capital Employed (ROCE), since that will give us an insight into how efficiently the business can generate profits from the capital it requires.
Firstly, we’ll go over how we calculate ROCE. Then we’ll compare its ROCE to similar companies. Finally, we’ll look at how its current liabilities affect its ROCE.
What is Return On Capital Employed (ROCE)?
ROCE is a metric for evaluating how much pre-tax income (in percentage terms) a company earns on the capital invested in its business. All else being equal, a better business will have a higher ROCE. Overall, it is a valuable metric that has its flaws. Author Edwin Whiting says to be careful when comparing the ROCE of different businesses, since ‘No two businesses are exactly alike.
So, How Do We Calculate ROCE?
The formula for calculating the return on capital employed is:
Return on Capital Employed = Earnings Before Interest and Tax (EBIT) ÷ (Total Assets – Current Liabilities)
Or for Sino-i Technology:
0.031 = HK$46m ÷ (HK$2.1b – HK$616m) (Based on the trailing twelve months to December 2019.)
Therefore, Sino-i Technology has an ROCE of 3.1%.
View our latest analysis for Sino-i Technology
Is Sino-i Technology’s ROCE Good?
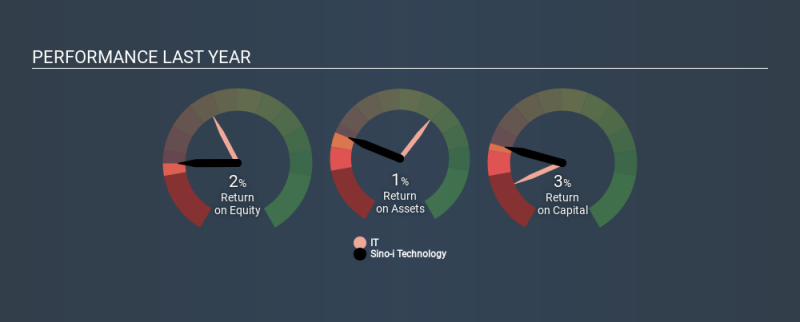
When making comparisons between similar businesses, investors may find ROCE useful. In this analysis, Sino-i Technology’s ROCE appears meaningfully below the 9.7% average reported by the IT industry. This could be seen as a negative, as it suggests some competitors may be employing their capital more efficiently. Regardless of how Sino-i Technology stacks up against its industry, its ROCE in absolute terms is quite low (especially compared to a bank account). There are potentially more appealing investments elsewhere.
Sino-i Technology delivered an ROCE of 3.1%, which is better than 3 years ago, as was making losses back then. That suggests the business has returned to profitability. The image below shows how Sino-i Technology’s ROCE compares to its industry, and you can click it to see more detail on its past growth.
SEHK:250 Past Revenue and Net Income March 30th 2020
When considering ROCE, bear in mind that it reflects the past and does not necessarily predict the future. ROCE can be deceptive for cyclical businesses, as returns can look incredible in boom times, and terribly low in downturns. ROCE is, after all, simply a snap shot of a single year. You can check if Sino-i Technology has cyclical profits by looking at this free graph of past earnings, revenue and cash flow.
Sino-i Technology’s Current Liabilities And Their Impact On Its ROCE
Current liabilities are short term bills and invoices that need to be paid in 12 months or less. The ROCE equation subtracts current liabilities from capital employed, so a company with a lot of current liabilities appears to have less capital employed, and a higher ROCE than otherwise. To check the impact of this, we calculate if a company has high current liabilities relative to its total assets.
Sino-i Technology has current liabilities of HK$616m and total assets of HK$2.1b. Therefore its current liabilities are equivalent to approximately 29% of its total assets. This is not a high level of current liabilities, which would not boost the ROCE by much.
The Bottom Line On Sino-i Technology’s ROCE
That’s not a bad thing, however Sino-i Technology has a weak ROCE and may not be an attractive investment. You might be able to find a better investment than Sino-i Technology. If you want a selection of possible winners, check out this free list of interesting companies that trade on a P/E below 20 (but have proven they can grow earnings).
I will like Sino-i Technology better if I see some big insider buys. While we wait, check out this free list of growing companies with considerable, recent, insider buying.
If you spot an error that warrants correction, please contact the editor at [email protected]. This article by Simply Wall St is general in nature. It does not constitute a recommendation to buy or sell any stock, and does not take account of your objectives, or your financial situation. Simply Wall St has no position in the stocks mentioned.
We aim to bring you long-term focused research analysis driven by fundamental data. Note that our analysis may not factor in the latest price-sensitive company announcements or qualitative material. Thank you for reading.


%20Might%20Not%20Be%20A%20Great%20Investment)