


Many investors are still learning about the various metrics that can be useful when analysing a stock. This article is for those who would like to learn about Return On Equity (ROE). By way of learning-by-doing, we’ll look at ROE to gain a better understanding of Kingfa Science & Technology (India) Limited (NSE:KINGFA).
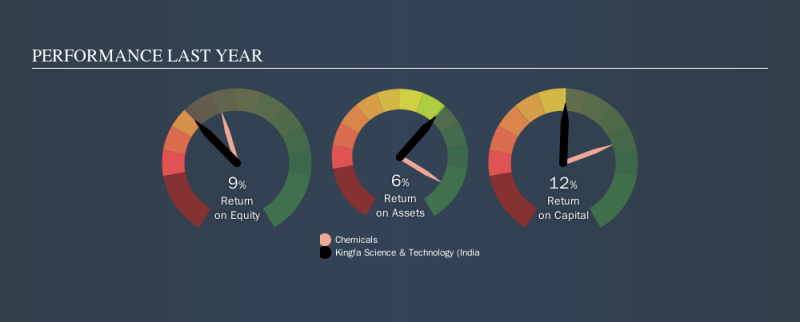
Over the last twelve months Kingfa Science & Technology (India) has recorded a ROE of 8.9%. One way to conceptualize this, is that for each ₹1 of shareholders’ equity it has, the company made ₹0.09 in profit.
View our latest analysis for Kingfa Science & Technology (India)
How Do You Calculate Return On Equity?
The formula for ROE is:
Return on Equity = Net Profit ÷ Shareholders’ Equity
Or for Kingfa Science & Technology (India):
8.9% = ₹288m ÷ ₹3.2b (Based on the trailing twelve months to June 2019.)
Most know that net profit is the total earnings after all expenses, but the concept of shareholders’ equity is a little more complicated. It is all earnings retained by the company, plus any capital paid in by shareholders. The easiest way to calculate shareholders’ equity is to subtract the company’s total liabilities from the total assets.
What Does Return On Equity Mean?
ROE measures a company’s profitability against the profit it retains, and any outside investments. The ‘return’ is the yearly profit. That means that the higher the ROE, the more profitable the company is. So, all else being equal, a high ROE is better than a low one. Clearly, then, one can use ROE to compare different companies.
Does Kingfa Science & Technology (India) Have A Good ROE?
By comparing a company’s ROE with its industry average, we can get a quick measure of how good it is. The limitation of this approach is that some companies are quite different from others, even within the same industry classification. As is clear from the image below, Kingfa Science & Technology (India) has a lower ROE than the average (13%) in the Chemicals industry.
NSEI:KINGFA Past Revenue and Net Income, October 28th 2019
That’s not what we like to see. It is better when the ROE is above industry average, but a low one doesn’t necessarily mean the business is overpriced. Still, shareholders might want to check if insiders have been selling.
How Does Debt Impact ROE?
Most companies need money — from somewhere — to grow their profits. That cash can come from issuing shares, retained earnings, or debt. In the first two cases, the ROE will capture this use of capital to grow. In the latter case, the debt used for growth will improve returns, but won’t affect the total equity. That will make the ROE look better than if no debt was used.
Combining Kingfa Science & Technology (India)’s Debt And Its 8.9% Return On Equity
Kingfa Science & Technology (India) has a debt to equity ratio of just 0.051, which is very low. Its ROE is rather low, and it does use some debt, albeit not much. That’s not great to see. Careful use of debt to boost returns is often very good for shareholders. However, it could reduce the company’s ability to take advantage of future opportunities.
The Key Takeaway
Return on equity is useful for comparing the quality of different businesses. A company that can achieve a high return on equity without debt could be considered a high quality business. If two companies have around the same level of debt to equity, and one has a higher ROE, I’d generally prefer the one with higher ROE.
Having said that, while ROE is a useful indicator of business quality, you’ll have to look at a whole range of factors to determine the right price to buy a stock. It is important to consider other factors, such as future profit growth — and how much investment is required going forward. So I think it may be worth checking this free report on analyst forecasts for the company.
Of course, you might find a fantastic investment by looking elsewhere. So take a peek at this free list of interesting companies.
We aim to bring you long-term focused research analysis driven by fundamental data. Note that our analysis may not factor in the latest price-sensitive company announcements or qualitative material.
If you spot an error that warrants correction, please contact the editor at [email protected]. This article by Simply Wall St is general in nature. It does not constitute a recommendation to buy or sell any stock, and does not take account of your objectives, or your financial situation. Simply Wall St has no position in the stocks mentioned. Thank you for reading.


%20Limited’s%20(NSE:KINGFA)%208.9%%20Return%20On%20Equity?)