


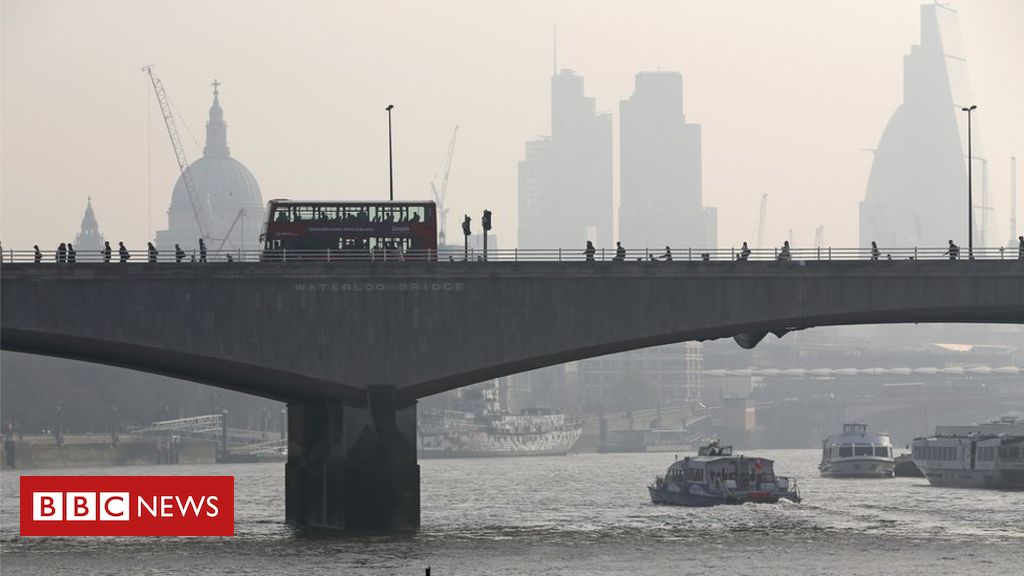

Image copyright
Getty Images
Our cities are increasingly under scrutiny over their impact on climate change. But in terms of carbon dioxide – one of the greenhouse gases responsible for global warming – could life away from the UK’s big towns be doing more damage?
According to the most recent government statistics, the UK’s 63 largest towns and cities – defined here as built-up urban areas with 135,000 or more people – account for almost half of all of the country’s carbon dioxide (or CO2) emissions.
London alone makes up 11% of the total.
But are these headline stats masking a more nuanced picture about the role of cities as contributors to climate change?
If we look at carbon emissions on a per resident basis, it could be that life in smaller towns, villages and the countryside has a greater impact.
The European Commission calculates UK emissions at 5.7 tonnes per person. That ranks the UK as one of the lowest carbon emitters per person among major economies. The US produces 15.7 tonnes per resident, while China – despite being the world’s largest CO2 polluter – emits a mid-range 7.7 tonnes per person.
UK government statistics for 2017 place the average slightly lower, at 5.3 tonnes per head.
All but 10 of our 63 largest towns and cities emit below that average, with Ipswich coming out as the greenest major town in the UK from a climate perspective. It emits three tonnes of CO2 for every resident.
Even London, despite valid worries about air quality, has the ninth-lowest carbon emissions per resident at 3.6 tonnes per person.
Meanwhile, energy-intensive steel and chemicals industries contribute to the Swansea area – including Neath Port Talbot – and Middlesbrough (combined with Stockton, and Redcar and Cleveland) having the highest carbon emissions per person in the UK, at 22.4 and 12.1 tonnes per head respectively.
Sources of carbon emissions
CO2 emissions per person, 2017 (tonnes)
Examining the sources of carbon emissions helps us understand why cities produce comparatively little CO2.
Though the differences are not huge, on average, homes in large towns emit slightly less CO2 per person than their more rural counterparts. They tend to be smaller, denser and easier to heat.
Twelve of the 20 local authorities with the lowest domestic CO2 emissions per person are London boroughs, with Tower Hamlets – which has the second smallest homes of any authority in England and Wales – emitting the least.
- Read more about the “housing revolution” in energy, in the BBC Briefing
One of the biggest differences in carbon emissions comes from transport, with CO2 emissions per head 66% higher away from cities. This is probably because more people drive private cars and make longer journeys for work and leisure.
Just 20% of British city dwellers travel more than 10km (6.2 miles) to work according to the latest Census, compared with a third of those who live away from major towns. Clearly, a lack of comprehensive public transport outside cities is a major factor.
Another significant difference is that economic activity in major towns tends to be more office and service-based, with manufacturing plants largely outside the boundaries of areas classed as cities.
For more on the UK’s efforts to tackle CO2 emissions, download the BBC Briefing on energy. Part of a mini-series of downloadable guides to the big issues in the news, it has input from academics, researchers and journalists and is the BBC’s response to demands for better explanation of the facts behind the headlines.
As well as being lower emitters per resident, cities are also decarbonising at a faster rate, cutting carbon emissions by 36% between 2005 and 2017, against 31% for other areas.
Although it remains a big polluter, the area around Middlesbrough has seen the biggest fall in emissions – 64% since 2011. This is linked to economic changes, with the closure of its major steelworks likely to have brought down overall emissions.
In contrast, industrial emissions in Slough rose between 2005 and 2017, as a likely result of changes to its local economy.
Providing high-quality job opportunities while keeping a lid on greenhouse gas production will be a difficult challenge for cities in the future.
Image copyright
Getty Images
However, cities cannot be judged by measuring CO2 alone.
While emissions from industrial sources fell by 48%, and domestic sources by 36%, the reduction in emissions from transport lagged at just 11%. This has implications for another major environmental concern of our age: air quality.
Transport on UK roads accounts for 32% of all nitrogen oxides, for example, which are linked to respiratory diseases, heart disease and lung cancer, according to 2017 figures. Of all roads that breach legal limits for nitrogen oxides, 88% are in cities.
More like this
Exhaust fumes in cities, where traffic volumes are highest, are trapped in by tall buildings. This also causes nitrous oxides to build up, resulting in air quality that is much poorer than it is in more rural areas.
So far only London has taken the concrete step of introducing an Ultra Low Emissions Zone to penalise polluting vehicles in a bid to clear its air.
Other cities will need to confirm and implement similar clean air plans if they are to both improve the air that their workers and residents breathe, and continue the fight against climate change.
Other types of air pollution
While carbon dioxide is a key focus of climate change policy, it is far from the only pollutant affecting cities. Others include:
- Particulate matter – particles from burning fuels, car tyre and brake wear can penetrate the lungs and cardiovascular system to cause stroke, heart disease, lung cancer and respiratory infections, the World Health Organization says. More than 40 UK towns and cities are at or exceed its limits
- Nitrous oxides – 16 UK cities remain in breach of European limits for nitrous oxides, which are responsible for lung problems. Government estimates suggest transport is responsible for 80% of emissions in those areas
- Ammonia – produced in farming activities like muck-spreading, it can cause burning and swelling of the lungs, and can be blown over cities. Levels in the air have been increasing since 2013
- Ozone – typically produced when vehicle emissions mix with sunlight, it tends to affect rural areas as it is destroyed by other pollutants in cities. It causes summer “smogs” and can bring on headaches, nausea and lung problems
Emissions per person in UK’s largest towns and cities*
- Ipswich: 3.0
- Worthing: 3.1
- Brighton: 3.2
- Southend: 3.2
- Luton: 3.2
- Chatham: 3.3
- Exeter: 3.4
- Plymouth: 3.4
- London: 3.6
- Southampton: 3.6
- Gloucester: 3.6
- Portsmouth: 3.6
- Bournemouth: 3.6
- Coventry: 3.7
- Birkenhead: 3.8
- Bradford: 3.9
- Northampton: 4.0
- York: 4.0
- Reading: 4.0
- Birmingham: 4.1
- Liverpool: 4.1
- Hull: 4.1
- Wigan: 4.1
- Basildon: 4.2
- Leicester: 4.2
- Blackburn: 4.2
- Blackpool: 4.3
- Nottingham: 4.3
- Cambridge: 4.3
- Glasgow: 4.4
- Oxford: 4.4
- Huddersfield: 4.4
- Manchester: 4.4
- Derby: 4.4
- Sheffield: 4.4
- Newcastle: 4.4
- Burnley: 4.5
- Dundee: 4.5
- Edinburgh: 4.5
- Bristol: 4.5
- Cardiff: 4.6
- Norwich: 4.6
- Mansfield: 4.7
- Belfast: 4.8
- Aldershot: 4.9
- Swindon: 4.9
- Stoke: 5.0
- Slough: 5.0
- Leeds: 5.1
- Peterborough: 5.1
- Milton Keynes: 5.2
- Sunderland: 5.2
- Telford: 5.3
- United Kingdom average: 5.3
- Crawley: 5.3
- Aberdeen: 5.4
- Barnsley: 5.6
- Wakefield: 5.8
- Preston: 5.8
- Newport: 6.1
- Warrington: 6.6
- Doncaster: 6.7
- Middlesbrough: 12.1
- Swansea: 22.4
* The Centre for Cities’ measure combines some authorities into one city area. For example, Swansea includes neighbouring Neath Port Talbot. See the full list.
About this piece
This analysis piece was commissioned by the BBC from an expert working for an outside organisation.
Paul Swinney is director of policy and research at Centre for Cities, a think tank dedicated to improving the performance of UK city economies.
You can follow him on Twitter.
Edited by Andy McFarlane


