


With the equity markets roiling of late, Bitcoin’s been surprisingly quiet. But the cryptocurrency looks ripe for a breakout soon – one that could vault it toward the all-time highs – or sending it tumbling down to long-term support.
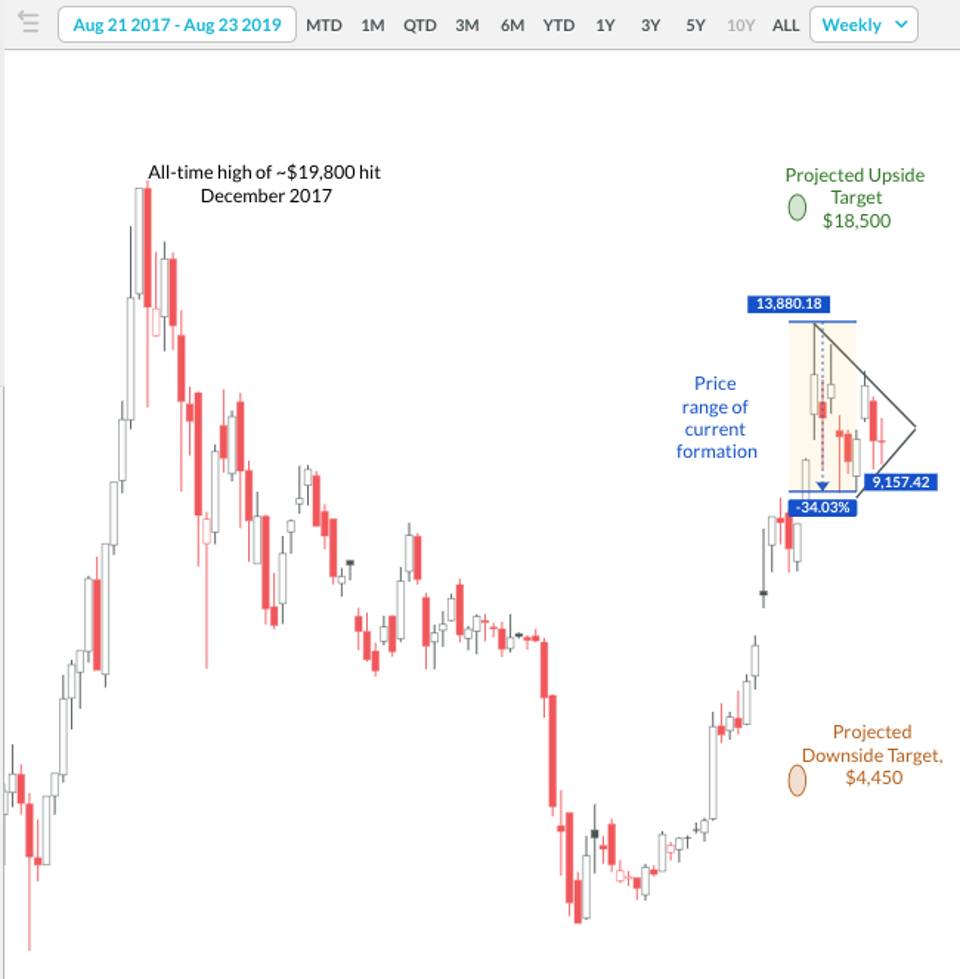
Since late June, Bitcoin’s meandered between the recent peak around $13,850 and recent low around $9,150 and trading around an increasingly narrow range. Technically, this has formed a symmetrical triangle, reflecting a rough balance between bulls and bears, without a lot of conviction either way, as the chart here shows.
Bitcoin is forming a symmetrical triangle. A sign a breakout is due.
Created with Koyfin.com
Volume’s been declining through the formation of the triangle. Volume – as tabulated by data.bitcoinity.org across various crypto trading platforms – shows about 1.32 million bitcoin trading the week of June 23, when the formation starts, falling to just over 500,000 this past week. This is classic volume behavior with this pattern, again, showing the lack of strong conviction of late of bulls or bears to push prices in one direction or the other. Odds are, that’s going to change very soon.
The term symmetrical triangle is a misnomer – the formation doesn’t need to be symmetrical, just showing two trendlines that eventually will converge. In Bitcoin, the triangle projects to late September, putting us about two thirds of the way through the formation right now. As a rule, symmetrical triangles break out anywhere from two-thirds through three-quarters of the way through the pattern. That means Bitcoin should get a lot more volatile by early September. More likely perhaps as soon as this week, given the open-close range for the week is the narrowest for Bitcoin since late June.
But which way will Bitcoin break? Symmetrical triangles are less predictive than other technical patterns, but we have hints. A large study of symmetrical triangles by Thomas N. Bulkowski in his Encyclopedia of Chart Patterns found that in a situation like Bitcoin, which has been in a bull move ahead of the triangle, odds are slightly better for a breakout upward than down, with 54% of the breakouts continuing the earlier bull move. The good news for Bitcoin bulls is a breakout higher could vault Bitcoin to near-record levels. The price target for a break out of a symmetrical triangle is the price distance between the priceswhich are the base of the triangle. That’s about $4,700 here, the difference between the top around $13,850 in late June and the recent low around $9,150. That upside target of $18,500 is almost to the peak Bitcoin from December 2017. The risk is the downside target is just as logical here, with $4,450 being a zone of long-term support (better support sits closer to $4,800 and would be a more logical destination.)
Up or down, Bitcoin’s move promises to be big either way.
Created with Koyfin.com
There are a ton of risks trading this formation. The rule of thumb is wait for the breakout – don’t anticipate it – and trade in its direction, but being aware that there is a good likelihood of a throwback or pullback. If those happen, the chances of a huge move lessen so be alert to a move that quickly moves against you. There also is the very rare possibility there’s no break out at all, and trading loses volume and range all the way through the apex of the triangle. But odds are, Bitcoin’s going to break out and when it does, it’ll be huge.


